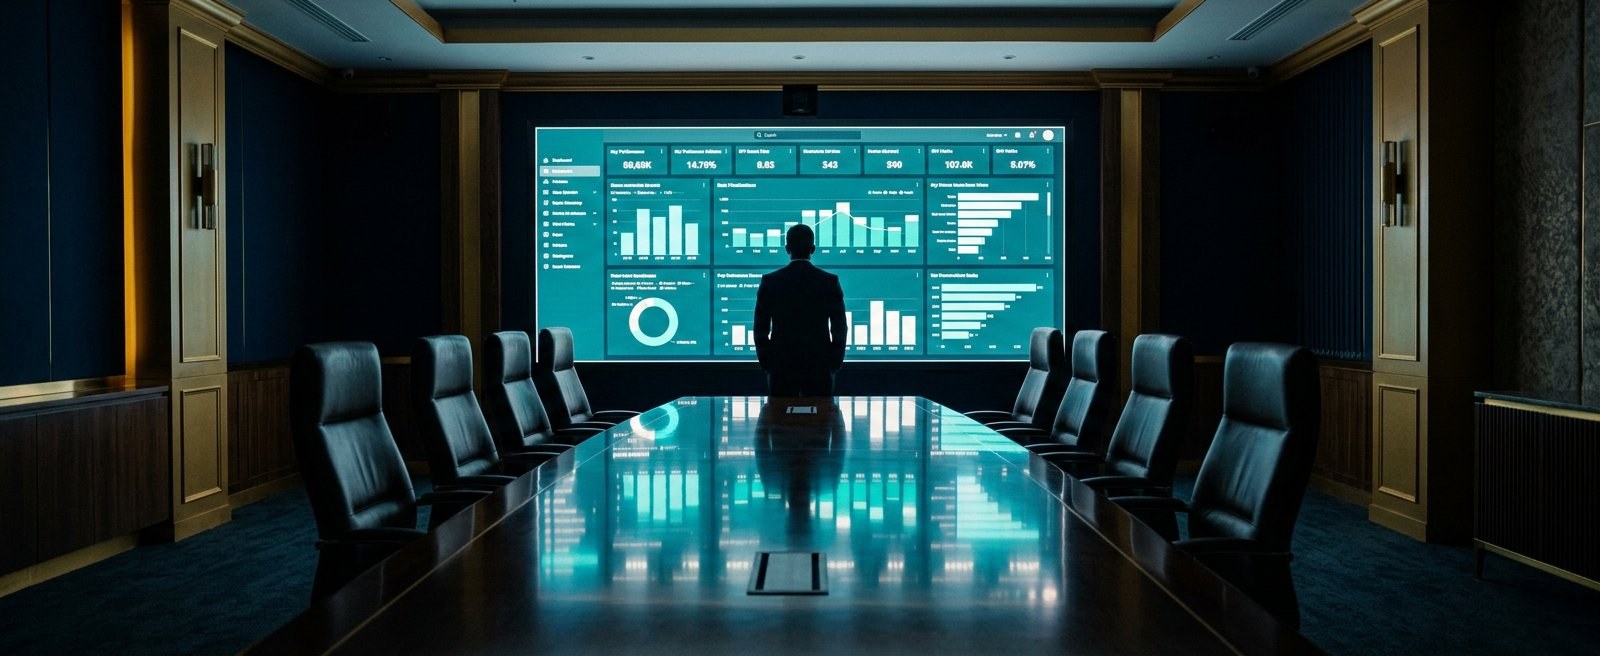
Real-time dashboards connected directly to your operational data, whether from SAP Business One, Tally, or any ERP. Financial MIS, sales performance, inventory, production, and profitability visibility, built by Chartered Accountants who understand what the numbers mean.
"We identify 20–30% more KPIs than clients typically ask for. Because our team reads a balance sheet before opening Power BI Desktop."
AVAGG Power BI PracticeMost businesses running on a functioning ERP have more operational data than they know what to do with. The problem is not the data, it is the absence of a layer that turns that data into management decisions.
Management is still receiving Excel-based MIS reports that arrive two weeks late, built manually by a finance team that has better things to do. Or they are receiving dashboards built by a design agency that look impressive but don't surface the metrics a CFO actually needs to run the business.
Our Power BI practice starts with a different question: what does your management team need to see tomorrow morning, and why isn't it visible today?
We connect Power BI directly to your SAP Business One HANA database, Tally export, or any structured data source, and build dashboards that refresh automatically as transactions happen. No manual exports. No reconciliation. No two-week delay.
Every dashboard we build is designed by a Chartered Accountant, not a designer. That means the metrics, the hierarchies, and the drill-down logic reflect how a finance team and management team actually need to interrogate the business, not what looks good in a demo.
You are producing management reports manually every month and they arrive too late to influence decisions. You need a live layer, not a faster spreadsheet.
You have invested in an ERP but management still cannot see the business in real time. Power BI sits on top of your existing data and delivers the analytics layer.
You need accurate, consistent, board-ready reporting that does not require three days of manual preparation every quarter.
The difference between a Power BI dashboard built by a design agency and one built by a CA firm is in the questions we ask before we build. We start with the chart of accounts, the cost centre structure, and the management reporting framework, then we build dashboards that reflect those structures accurately.
We identify 20–30% more relevant KPIs than clients typically ask for, because our team understands what metrics matter at different stages of business scale and across different industry sectors. We have delivered dashboards across manufacturing, medical devices, trading, real estate, and financial services.
Business blueprint first. Technology second. Every time.
Our founding principleWe respond to all enquiries within 24 business hours. No obligation, no sales pitch, just a conversation.